
You have 1,000 survey responses and a headline number: 37.8% of respondents say they would buy the product. That is a useful start, but the next question arrives immediately. Who are they? Does the answer change by age, by region, by whether they already use a competitor?
A crosstab answers those questions. You will also see it written as cross tab or crosstabs, and statisticians call it a contingency table. This guide shows what a crosstab looks like, walks through several crosstab examples, defines the vocabulary, and points to a deeper article for each step.
Key takeaways
- A crosstab puts the answers to one question down the side and the groups of another across the top, so you can compare groups side by side.
- Column percentages show what share of each group gave each answer. Always check the base under each column.
- Significance letters mark which differences between columns are larger than sampling noise.
- A banner table runs many crosstabs at once, cutting every question by the same set of groups.
What does a crosstab look like?
Here is a small crosstab with illustrative numbers (not real survey data). The question is purchase intent, grouped into three nets from a five-point scale, and the respondents are cut by age band.
| Purchase intent | Total | 18–34 (A) | 35–54 (B) | 55+ (C) |
|---|---|---|---|---|
| Base: all respondents | 1,000 | 400 | 350 | 250 |
| Net: would buy (top 2) | 378 (37.8%) | 192 (48.0%) BC | 126 (36.0%) C | 60 (24.0%) |
| Might or might not buy (middle) | 300 (30.0%) | 120 (30.0%) | 105 (30.0%) | 75 (30.0%) |
| Net: would not buy (bottom 2) | 322 (32.2%) | 88 (22.0%) | 119 (34.0%) A | 115 (46.0%) AB |
Each cell holds a count and, in brackets, a column percentage. The column percentage is the count divided by the base at the top of that column. For the 18–34 column, 192 divided by 400 is 48.0%. Every column adds up to 100%: 48.0 + 30.0 + 22.0 for the first one.
The bold letters are significance markers. The “BC” next to 48.0% says that 18–34 respondents are more likely to buy than both the 35–54 and 55+ groups. In this illustration the differences were tested with a two-proportion test at 95% confidence.
The story is now visible. Intent falls steadily with age, and the oldest group is the most likely to say no. The total column alone, at 37.8%, hid all of that.
What does a crosstab of real survey data look like?
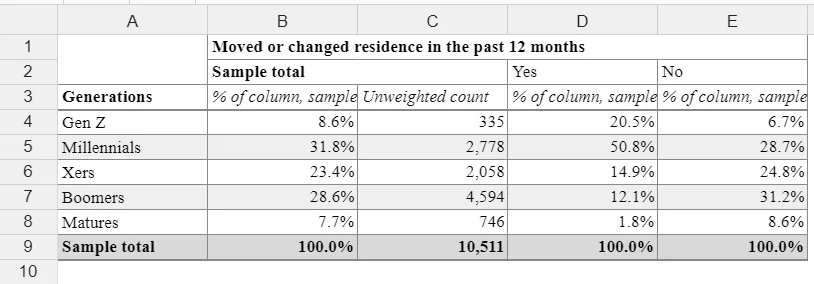
The next table, from a sample of about 10,500 respondents, shows generations by whether people moved or changed residence in the past 12 months. Each cell shows a column percentage and the unweighted count.
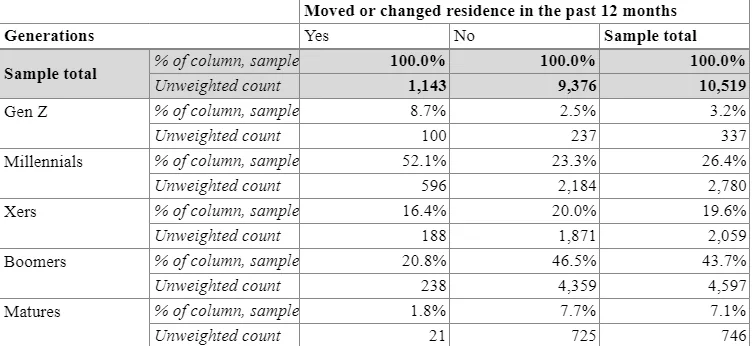
Read down the “Yes” column. Of the 1,143 people who moved, 100 are Gen Z, which is 8.7% (100 divided by 1,143). Among the 9,376 who did not move, Gen Z is only 2.5%. Millennials are 52.1% of movers and 23.3% of non-movers, while Boomers are 20.8% of movers and 46.5% of non-movers.
The pattern is clear: people who moved skew younger. In statistical terms the two variables are associated. If there were no relationship, the percentages in the “Yes” and “No” columns would look about the same.
What are crosstabs used for?
Crosstabs are the standard output of survey analysis in market research, and they are common in social science and healthcare research too. Whenever the question is “does this differ by group?”, a crosstab is the first table to build: satisfaction by region, awareness by brand user, intent by age.
They also scale well. One question cut by one set of groups fits on a page, so a full study becomes a stack of pages read the same way every time. For questionnaire data, how to crosstab survey data covers the practitioner workflow from raw file to first tables.
What are some crosstab examples?
Here are three short crosstab examples built on common business questions. The numbers are illustrative. Each table shows column percentages, with the base at the top.
Customer satisfaction by region
| Satisfaction | Total | North America | Europe | Asia-Pacific |
|---|---|---|---|---|
| Base | 600 | 250 | 200 | 150 |
| Satisfied (top 2) | 65.7% | 72.0% | 65.0% | 56.0% |
| Neutral | 18.3% | 16.0% | 20.0% | 20.0% |
| Dissatisfied (bottom 2) | 16.0% | 12.0% | 15.0% | 24.0% |
The total of 65.7% (394 satisfied out of 600) looks healthy. The crosstab shows Asia-Pacific at 56.0%, with almost one in four customers dissatisfied, twice the North America rate. That is the region to look at first, once a significance test confirms the gap.
Net Promoter Score by customer tenure
| Likelihood to recommend | Total | Under 1 year | 1–3 years | Over 3 years |
|---|---|---|---|---|
| Base | 800 | 200 | 300 | 300 |
| Promoters (9–10) | 40.0% | 25.0% | 40.0% | 50.0% |
| Passives (7–8) | 33.1% | 35.0% | 35.0% | 30.0% |
| Detractors (0–6) | 26.9% | 40.0% | 25.0% | 20.0% |
| NPS | +13 | −15 | +15 | +30 |
NPS is the promoter percentage minus the detractor percentage, so the newest customers score 25.0 − 40.0 = −15. Overall the score is +13, yet customers in their first year are net detractors. That points the team toward the early relationship rather than the product as a whole.
Concept preference by customer status
| Preferred concept | Total | Current customers | Non-customers |
|---|---|---|---|
| Base | 500 | 200 | 300 |
| Concept A | 43.0% | 55.0% | 35.0% |
| Concept B | 42.0% | 30.0% | 50.0% |
| No preference | 15.0% | 15.0% | 15.0% |
On the total, the two concepts are tied at 43.0% and 42.0%. Split by customer status, the tie disappears: current customers prefer A by 25 points and non-customers prefer B by 15. Which concept wins depends on whether the launch is meant to keep customers or win new ones, a question the total alone would never have raised.
What is the terminology behind a crosstab?
Crosstabs come with a short vocabulary. Once you know these terms, a report from almost any tool becomes readable.
| Term | What it means | In the purchase-intent example |
|---|---|---|
| Stub | The row labels down the left side, usually the answers to one question | The three purchase-intent rows |
| Banner | The column headings across the top, usually demographics or segments | Total, 18–34, 35–54, 55+ |
| Cell | One intersection of a row and a column | 192 (48.0%) |
| Base | The number of respondents a percentage is calculated on | 400 for the 18–34 column |
| Net | Two or more answer categories combined into one row | Would buy = definitely plus probably |
| Column percentage | A cell count divided by the column base | 48.0% = 192 / 400 |
| Row percentage | A cell count divided by the row total | 50.8% = 192 / 378 |
| Significance letter | A marker showing a cell is statistically higher than another column | BC beside 48.0% |
What is a banner?
A banner is the standard set of column groups applied across a whole report: total, then demographics, segments, brands used and regions. Defining it once means every question is cut the same way, so results are comparable from page to page. Banners can be nested, such as income within gender, though every nested column has a smaller base. How banner tables work in market research covers how to plan and specify one.
What is a base?
The base is the group a percentage is calculated on. It is the most overlooked part of a crosstab. A 60% on a base of 20 people and a 60% on a base of 2,000 look identical and mean very different things.
Weighted data adds a wrinkle. Show both the unweighted count (actual respondents) and the weighted base (what the weights make the sample represent), and say which one the percentages use.
What is a net?
A net combines categories so a result is easier to read and less noisy. The “top 2 box” on a five-point intent scale, “definitely” plus “probably” would buy, is a net. So is an age net such as 18–34 built from several narrower bands. Always make clear which answers sit inside a net.
Should percentages be column or row percentages?
Column percentages answer “of the people in this group, what share said this?” That is the convention in survey reporting, because the columns are the groups you want to compare.
Row percentages answer “of the people who said this, what share belong to each group?” In the example, the 378 people who would buy split into 192 aged 18–34, 126 aged 35–54 and 60 aged 55+. Divided by 378, that is 50.8%, 33.3% and 15.9%, which add up to 100.0%.
Both are correct, but they answer different questions. Notice that 18–34 respondents are 40% of the sample, so they would make up about 40% of buyers even if age made no difference. A row percentage mixes the attitude with the sample’s makeup, so state which one a table uses.
The generations table works the same way. Using its counts, 100 of the 337 Gen Z respondents moved, which is 29.7%, compared with 21 of 746 Matures, which is 2.8%. That row view tells you how likely each generation was to move. The column view told you who the movers are.
How do you make a cross tab?
Making a cross tab comes down to four choices: the question you want to understand (the rows), the groups you want to compare (the columns), the percentage direction, and the confidence level for testing differences. For the full method, including the chi-square test of whether two variables are related, see cross tabulation analysis, step by step. In a spreadsheet, a pivot table gets you a basic version, and building a crosstab in Excel shows how and where it runs out.
What does a crosstab with more than two variables look like?
A two-way table has one variable down the side and one across the top. Most survey reports go further. The table below puts beer consumption in the rows and three variables in the columns: age, and annual income within gender, which is a nested banner.
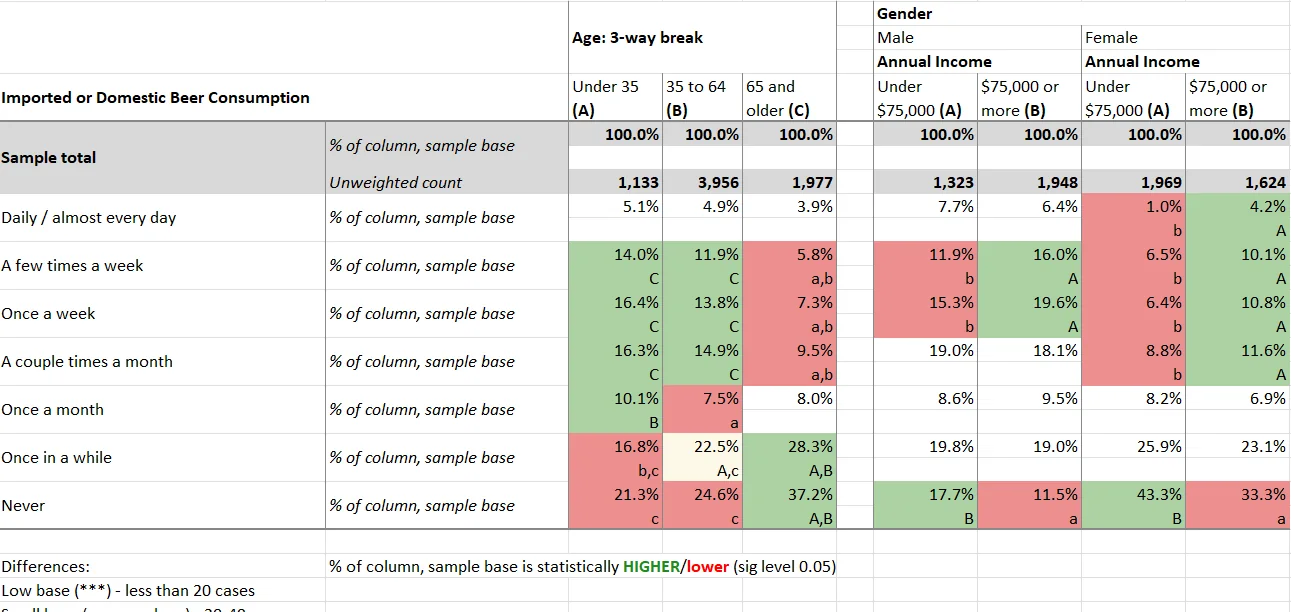
It also shows significance testing in a real report. Columns are labeled A, B and C within each group. In the age block, “C” under 14.0% for the under-35 group means that figure is significantly higher than the 65-and-older column. Green shading marks a figure significantly higher and red marks one significantly lower, at the 0.05 level shown in the table notes. The notes also flag low bases: results on fewer than 20 cases are marked.
A one-way table summarizes a single question. A two-way table adds a second variable as columns, and because the business question is usually “for whom” rather than “how many”, most findings live there. One-way vs. two-way tables and where crosstab software fits covers how the two relate.
How do you read a crosstab?
Read the base first, then confirm whether the table shows column or row percentages, then check the significance markers, and only then look for the pattern across a row. Multiple-response questions add up to more than 100%, because the base is respondents, not answers. How to read a crosstab walks through a full table in that order, with the traps to watch for at each step.
What do the letters in a crosstab mean?
Each column in a tested crosstab gets a letter, and a letter beside a cell says that cell is significantly higher than the column carrying that letter, usually at 95% confidence. With dozens of comparisons on a page, roughly one in twenty tests on pure noise will still pass at that level, so treat an isolated flag with care. Significance testing in crosstabs explains the tests behind the letters and how to set them up.
When should you use a crosstab instead of a pie chart?
A pie chart shows how one group divides into parts of a whole. It works when you have one group, a handful of categories and the point is the share, for example how total respondents split across three plans.
A crosstab is better when the question compares groups. A pie chart for each age band would force the reader to compare slice angles across three circles. The table puts 48.0%, 36.0% and 24.0% next to each other. A crosstab also carries things a pie cannot: the base, the significance markers and many answer categories without clutter.
They work together. Use the crosstab to find the pattern, then chart only the cells that carry the finding, usually as a bar chart, while the table keeps the evidence and the base behind each bar.
How is a crosstab different from a pivot table or a list?
A pivot table also summarizes two fields in a grid, so the two get confused. But a pivot table counts records in a spreadsheet, while survey analysis needs weighting, multiple-response handling, nested banners, consistent bases and significance testing across hundreds of questions and several waves. The full comparison, including alternatives, is in the difference between crosstabs and pivot tables.
A plain list of results is a different tool again. It is fine when you want one ranked set of answers for a single group. If you are weighing the two, crosstab vs. list: pros, cons and best uses lays out when each wins.
What are the most common crosstab mistakes?
- Reading row percentages as column percentages. The two numbers can differ widely, and the wrong one leads to the wrong conclusion about who does what.
- Ignoring the base. A striking percentage on 15 respondents is not a finding. Look at the base before the number.
- Treating an unflagged difference as real. A gap of a few points between two columns may be noise. Rely on the significance markers rather than the eye.
- Cutting the data too many ways. Each extra layer of banner shrinks the bases and multiplies the comparisons, so more spurious flags appear. Define the cuts from the questions you are trying to answer.
- Concluding cause from association. A crosstab shows that groups differ. It does not explain why.
How do you create crosstabs in practice?
For a handful of questions you can build crosstabs by hand or with a pivot table. For a full study, crosstab software and how to choose it saves you from rebuilding the same table for every question and every wave. Halo Reports, mTab’s reporting product, produces crosstabs and banner tables with weighting and significance testing, along with charts and interactive report pages. When a follow-up question comes up that your banner does not cover, you can ask it in plain language and get an answer from your own research, with the source shown.
What should you do next?
Pick one decision you are working on and one question that bears on it. Write down the two or three groups you suspect will answer differently, set your minimum base size, and build a single crosstab for that question. If the table raises a better question, that is the next table to build. Insights teams that run wide, complex studies and global trackers can keep that work on one governed platform.