
You have written five statements about brand trust, asked every respondent to rate them, and now you want to add the ratings into a single trust score. Before you report that score, you need some evidence that the five statements are measuring the same thing. Cronbach’s alpha is the standard first check, and it is quick to run once you know what it is actually telling you. It is one of the reliability checks in our guide to survey data quality, alongside the wider question of reliability and validity.
Key takeaways
- Cronbach’s alpha measures how consistently respondents answer across several items meant to capture one concept, so you can check a combined score before you report it.
- Alpha is calculated from the item variances and the variance of the total score, and removing one off-topic item lifted the worked example from 0.60 to 0.93.
- An alpha of 0.70 to 0.90 is usually acceptable for group-level tracking, while values above about 0.90 to 0.95 suggest redundant items.
- Alpha rises as you add items even when the items are no better, so check the average inter-item correlation as well.
- Alpha does not prove validity, a single dimension or stability over time, so treat it as a diagnostic rather than a target to maximize.
What does Cronbach’s alpha measure?
Many ideas in market research cannot be captured by one question. Trust, satisfaction and brand attachment are easier to measure with several related items combined into one score. Cronbach’s alpha, also called coefficient alpha, reports how consistently respondents answer across those items.
A high alpha means the items move together: a respondent who agrees with one statement tends to agree with the others. A low alpha means the items are pulling in different directions, because they measure different things, because one is badly worded, or because there is too much random noise in the answers.
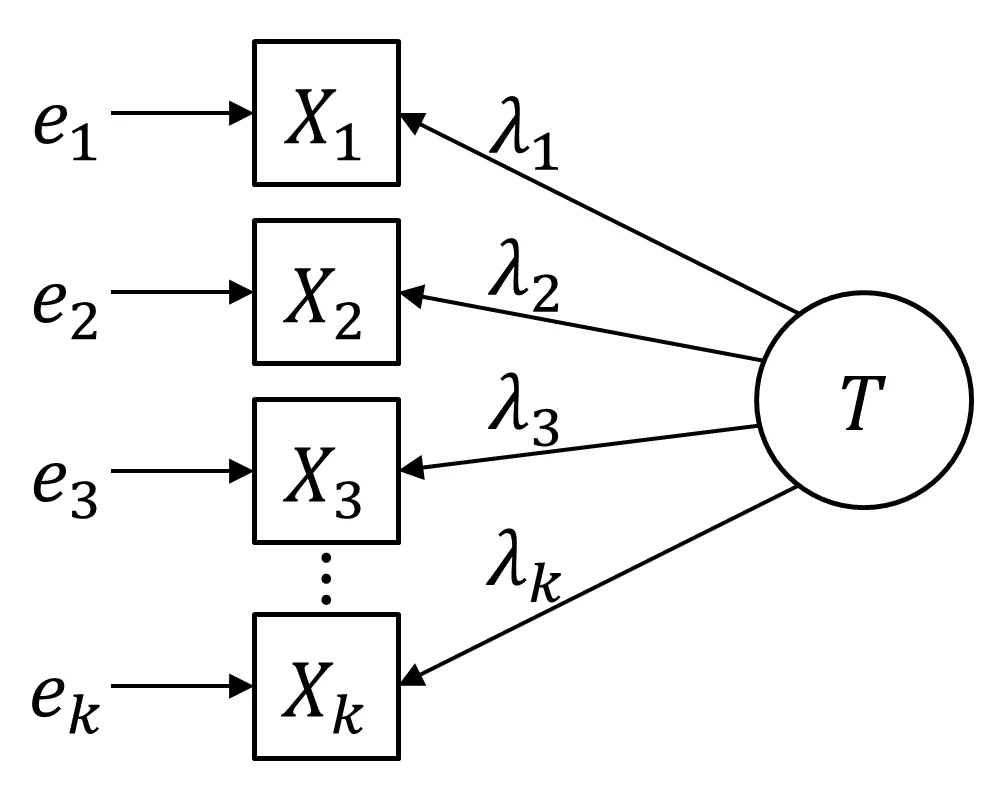
This is internal consistency, one kind of reliability. The diagram below shows the model behind it. Each item (X1 to Xk) is driven partly by the underlying concept (T) through a loading (λ), and partly by its own error term (e). Alpha asks how much of the variation in the total score comes from the shared concept rather than from the errors.
One point is worth getting right early. Alpha is sometimes described as the chance that a respondent would give the same answer if you asked again and again. That is closer to test-retest reliability, which compares two rounds of the same questions. Alpha needs only one round of data, because it uses the different items as stand-ins for repeated measurements.
When should you use Cronbach’s alpha?
Use alpha when you have a set of items that meet three conditions:
- You believe the items all measure one underlying concept.
- The items should be correlated with one another if that belief is right.
- You plan to combine them into a total or average score.
Typical examples are a five-item brand trust scale or a satisfaction index built from several ratings. Alpha is not meant for a single question, or for questions that deliberately cover different topics, such as awareness, price perception and packaging. Those items are not supposed to move together.
The items also need a common scoring direction. Recode negatively worded statements first so that a high number always means more of the concept. Skipping this step is a common reason for a puzzling or even negative alpha.
Alpha is usually computed on rating-scale items. Rating scales are ordinal, and alpha treats the numbers as if the gaps between points were equal. That is common practice and usually works well enough, but it is worth knowing what you are assuming, which is covered in Mind Your Measurement Scales in Market Research. For items with only two answers, such as yes or no, the same idea is available as a special case called KR-20.
How do you calculate Cronbach’s alpha?
The formula is:
alpha = (k / (k - 1)) × (1 - (sum of item variances) / (variance of total score))Here k is the number of items. The item variances are the variances of each item’s scores across respondents. The total score is each respondent’s sum across all k items, and its variance is taken across respondents.
If the items are unrelated, the variance of the total is about the same as the sum of the item variances, the fraction is close to 1, and alpha is close to 0. If the items move together, the total varies much more than the items add up to, the fraction shrinks, and alpha rises. The k / (k - 1) term is a correction for the number of items.
How do you work through an example?
The numbers below are illustrative, not real survey data, and six respondents is far too few for a real test. They show the arithmetic. Four statements about a brand are rated from 1 (strongly disagree) to 5 (strongly agree):
- A: “I trust this brand to deliver what it promises.”
- B: “This brand is honest with its customers.”
- C: “I would rely on this brand when it matters.”
- D: “This brand is often in the news.”
| Respondent | A | B | C | D | Total |
|---|---|---|---|---|---|
| 1 | 4 | 4 | 5 | 2 | 15 |
| 2 | 2 | 3 | 2 | 3 | 10 |
| 3 | 5 | 4 | 4 | 4 | 17 |
| 4 | 3 | 3 | 3 | 3 | 12 |
| 5 | 1 | 2 | 2 | 4 | 9 |
| 6 | 4 | 5 | 4 | 2 | 15 |
Step 1: item variances. Using the sample variance (divide by n - 1 = 5), item A has a mean of 3.17 and a sum of squared deviations of 10.83, so its variance is 10.83 / 5 = 2.17. The same calculation gives 1.10 for B, 1.47 for C and 0.80 for D. The sum of the item variances is 2.17 + 1.10 + 1.47 + 0.80 = 5.53.
Step 2: variance of the total. The six totals are 15, 10, 17, 12, 9 and 15, with a mean of 13. The squared deviations are 4, 9, 16, 1, 16 and 4, which add to 50, so the variance is 50 / 5 = 10.00.
Step 3: apply the formula. With k = 4:
alpha = (4 / 3) × (1 - 5.53 / 10.00) = 1.333 × 0.447 = 0.60An alpha of 0.60 is below the usual threshold. Look at the table and the reason is visible. Items A, B and C rise and fall together, but D does not: respondent 5 gives the lowest scores on the three trust statements and a 4 on D. That makes sense, because whether a brand is in the news is not the same as whether you trust it.
Step 4: remove the weak item and recalculate. Without D, the three totals per respondent are 13, 7, 13, 9, 5 and 13. Their mean is 10, the squared deviations are 9, 9, 9, 1, 25 and 9, which add to 62, and the variance is 62 / 5 = 12.40. The item variances now sum to 2.17 + 1.10 + 1.47 = 4.73. With k = 3:
alpha = (3 / 2) × (1 - 4.73 / 12.40) = 1.5 × 0.618 = 0.93Alpha jumps from 0.60 to 0.93 once D is removed. In real work you would not delete an item on the number alone. You would ask why it behaves differently. Here the answer is wording: item D is about visibility, not trust.
Why does the number of items matter?
Alpha rises as you add items, even when each item is no better than before. For standardized items, alpha can be written in terms of the number of items and the average correlation between them (r):
alpha = (k × r) / (1 + (k - 1) × r)With an average inter-item correlation of 0.30, that gives alpha of about 0.63 for 4 items, 0.81 for 10 items and 0.90 for 20 items. The items are no more closely related in the longer scale. There are just more of them. This is why a long scale of weak items can post an impressive alpha, and why you should look at the average inter-item correlation as well as alpha itself.
What is a good Cronbach’s alpha?
There is no law of nature behind the thresholds. They are conventions, and the right bar depends on what the score will be used for. The bands below are the ones most often quoted in survey work.
| Alpha | Common reading |
|---|---|
| Below 0.60 | Weak. Revise or replace items before using the score. |
| 0.60 to 0.70 | Questionable. Sometimes accepted for early, exploratory work. |
| 0.70 to 0.90 | Acceptable to good for research and tracking at group level. |
| Above about 0.90 to 0.95 | Check for redundancy. Some items may be near duplicates. |
A higher bar, often 0.80 or 0.90, is usually applied when scores will be used to make decisions about individual people rather than to compare groups. For a brand tracker that reports averages by segment, 0.70 or higher is the usual expectation.
Two cautions go with any threshold. A very high alpha is not automatically a good sign: if five items are the same question reworded, respondents answer it five times and you gain little except fatigue. And alpha comes from your sample, not from the instrument. The same scale can score differently in a new country, audience or wave, so check it again when conditions change.
What does Cronbach’s alpha not tell you?
It does not show validity. A scale can be consistent and still measure the wrong thing. If every item in a “brand trust” scale is really about familiarity, the items will agree with each other and alpha will be high. Validity needs separate evidence, such as whether the score relates to other measures in the way you would expect. Validating a survey is a wider job than checking one statistic.
It does not show that the scale is unidimensional. A high alpha does not prove that all the items measure a single concept. Combine a trust scale and a value-for-money scale into one long set of items and alpha will often still look respectable, even though two concepts are in there. Factor analysis is the tool for checking how many dimensions the items actually form.
It does not measure stability over time. Alpha tells you about consistency across items on one occasion. It says nothing about whether the same person would score the same next month.
It makes assumptions about the items. Alpha equals the true reliability of the total score only when all items load equally on the underlying concept, a condition called tau-equivalence. When loadings differ, which is common, alpha tends to understate reliability. Analysts who want a measure that allows unequal loadings often use McDonald’s omega alongside alpha. And as noted earlier, alpha treats ordinal ratings as if they were evenly spaced.
How do you improve a scale using Cronbach’s alpha?
Treat alpha as a diagnostic, not a target to maximize. The steps below work for a pilot test before launch and for a scale you already field.
- Check the data first. Recode reverse-worded items, look for respondents who gave the same answer to every item, and confirm every item uses the same direction and the same number of points.
- Compute alpha and the average inter-item correlation. Alpha alone can flatter a long scale.
- Read the item-level output. Most statistics packages report “alpha if item deleted” and the correlation of each item with the rest of the scale. An item whose removal raises alpha, or whose correlation with the others is low, is a candidate for review.
- Look at the wording before you drop anything. Is the item ambiguous, double-barreled, or about something slightly different from the others, like item D above? Rewording and re-testing is often better than deleting.
- Check dimensionality. If several items refuse to fit, run a factor analysis to see whether the scale is really two scales. Exploratory factor analysis is the usual starting point.
- Remove or merge near duplicates. If alpha is above 0.90 and the wording of two items is almost identical, drop one and see what the number does.
- Recheck on new data. A scale tuned to one sample can look better on that sample than it will in the next one.
For a tracker, calculate alpha every wave and keep it next to the scale score. A sudden drop is a prompt to look at wording changes, translation, a new sample source or a change in the audience before you report a trend in the score itself.
How do you run Cronbach’s alpha in practice?
Alpha is available in most statistics packages and in common programming libraries, usually with the item-level output described above. Once you have a tested composite score, the reporting work starts. Halo Reports handles crosstabs and banner tables with weighting and significance testing, plus charts and interactive report pages, so you can break the finished score down by segment and share it.
What mistakes do people make with Cronbach’s alpha?
- Applying it to items that are not meant to be one scale. A set of questions on awareness, price and packaging should not move together, so a low alpha there means nothing.
- Forgetting to recode reversed items. One negatively worded item left as it was can drag alpha down or push it negative.
- Chasing a high number. Dropping items until alpha is very high leaves near-duplicates and may cut parts of the concept you meant to measure.
- Treating alpha as proof of validity or of one dimension. It supports neither claim, as shown above.
- Reusing a published alpha. A value from another study describes that study’s sample. Calculate it on yours.
- Calculating it on a tiny pilot and trusting it. With a handful of respondents alpha swings widely. Use a pilot to find odd items, and confirm on a proper sample.
What should you do next?
Pick one multi-item scale you already use, recode any reversed items, and run alpha with the item-level output on your latest data. Write down the value, the average inter-item correlation and any item that stands out, then read the wording of that item before deciding anything. If the scale passes, keep the result alongside the score so you can compare it next wave. If you run wide studies and global brand trackers, one governed platform for insights and research teams can keep those scores together.