
You have 20 candidate product features, a limited budget, and a survey in which every feature was rated “important” by most respondents. That result tells you almost nothing about what to build first. MaxDiff is designed for exactly this problem, and it is one of the prioritization methods covered in our overview of the market research process, from the first step to segmentation, conjoint and MaxDiff.
Key takeaways
- MaxDiff analysis is a survey method in which respondents pick the best and the worst item from small sets, producing a preference score for every item.
- Each task shows three to five items, usually four or five, and a balanced design shows every item and pair equally often.
- The count score is (times best minus times worst) divided by times shown, running from -1 to +1 and summing to zero across items.
- MaxDiff beats rating scales for prioritization because choosing a best means something else loses, so preferences separate and ties are rare.
- Show each item at least three times per respondent, and use conjoint instead when you need to set prices or configure products.
What is MaxDiff analysis?
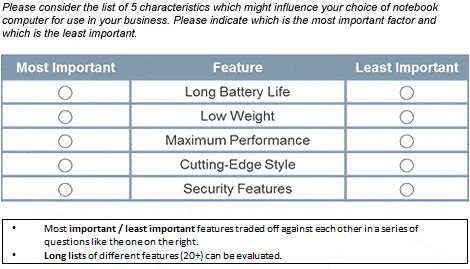
MaxDiff asks people to make a forced choice instead of giving a score. In each question, a respondent sees a small set of items and marks the one they like most and the one they like least. The method rests on a simple observation: people find it easier to say which option is best and which is worst than to put a number on every option.
The items can be product features, marketing messages, brand claims or service improvements. Across many sets and respondents, the pattern of “most” and “least” choices reveals a full ranking, with a measurable distance between items. MaxDiff is related to conjoint but does a different job, as we compare below.
How is a MaxDiff task built?
Each task is a set of three to five items, and four or five is the usual choice. The respondent picks one “best” and one “worst”, which means each answer carries two pieces of information. A longer survey is built by repeating this with different combinations of items.
The combinations are not random. A good design is balanced, which means:
- every item appears the same number of times,
- every pair of items appears together the same number of times, and
- each item shows up in different positions on the screen.
Here is the smallest balanced design for five items shown four at a time. Each set leaves out exactly one item.
| Set | Items shown |
|---|---|
| 1 | Low weight, Maximum performance, Style, Security features |
| 2 | Long battery life, Maximum performance, Style, Security features |
| 3 | Long battery life, Low weight, Style, Security features |
| 4 | Long battery life, Low weight, Maximum performance, Security features |
| 5 | Long battery life, Low weight, Maximum performance, Style |
Every item appears in four of the five sets, and every pair appears together in three. Real studies have more items, so software generates the sets, but the principle is the same.
How do you score MaxDiff results?
The simplest scoring method is a count. For each item, subtract the number of times it was picked worst from the number of times it was picked best, then divide by the number of times it was shown.
Score = (times best − times worst) ÷ times shown
The numbers below are illustrative. Suppose 200 respondents each answer the five sets above, so each item is shown 4 × 200 = 800 times, and there are 1,000 best picks and 1,000 worst picks in total.
| Item | Times shown | Best | Worst | Best − worst | Score |
|---|---|---|---|---|---|
| Long battery life | 800 | 340 | 60 | 280 | 0.350 |
| Maximum performance | 800 | 280 | 100 | 180 | 0.225 |
| Low weight | 800 | 160 | 120 | 40 | 0.050 |
| Security features | 800 | 160 | 260 | −100 | −0.125 |
| Style | 800 | 60 | 460 | −400 | −0.500 |
For battery life, (340 − 60) ÷ 800 = 0.35. The scores run from −1 (always worst) to +1 (always best) and always sum to zero across items, which is a useful check on your arithmetic. Battery life leads, performance follows, and style is clearly the least valued feature.
Count-based scores are good for a first look. Most MaxDiff software goes further and fits a choice model, often a multinomial logit estimated with hierarchical Bayes, which produces a utility for each item for each respondent. You need that for segment-level results.
Why is MaxDiff better than rating scales for prioritization?
Rating scales let everything win. Ask people to rate 20 features from 1 to 10 and many will give most of them 8, 9 or 10, so you end up with a list of near-ties. Respondents also use scales differently: one person’s 7 is another person’s 10, and that style can vary by culture or by individual habit.
MaxDiff avoids both problems because choosing a best means something else loses. Preferences separate, ties are rare, and nobody has a scale to misuse. The questions are also short and easy to answer.
The cost is length. Rating 20 items takes one grid, while MaxDiff takes around a dozen tasks. Use rating scales when you need an absolute reading of each item on its own, and MaxDiff when you need a ranked order.
What is the difference between MaxDiff and conjoint analysis?
Both methods make respondents choose, and both estimate preference scores from those choices. The difference is what respondents see.
| MaxDiff | Conjoint | |
|---|---|---|
| What is shown | A flat list of single items | Complete product profiles built from attributes and levels |
| Question | Which is best and which is worst? | Which profile would you choose? |
| Output | Relative preference for each item | Value of each attribute level, trade-offs, price sensitivity |
| Best for | Prioritizing features, claims, messages, names | Pricing, product configuration, market-share simulation |
If your question is “which of these 20 things matters most?”, use MaxDiff. If it is “which combination of features at which price will people choose?”, use conjoint analysis. Many teams run MaxDiff first to narrow a long list, then conjoint on the shortlist.
What mistakes should you avoid when designing a MaxDiff study?
- Showing each item too few times. If a respondent sees an item once or twice, their preference for it is a guess. Aim for each item to appear at least three times per respondent, and cut the list if that makes the survey too long.
- Mixing items that cannot be compared. “Lower price” and “better battery” are not the same kind of thing. Keep items at the same level of detail and in the same category, and test price separately.
- Overlapping or vague wording. If two items mean nearly the same, respondents split their picks between them and both look weaker.
- Skipping the balanced design. Hand-built sets often show some items more often, or always in the same position, and that bias flows into the scores. Generate the design with software.
- Reading scores as absolute importance. A top-ranked item is only the best of the list you tested. It could still be unimportant, because the method does not say whether anything on the list matters.
- Averaging across very different people. An overall ranking can hide groups that want opposite things. Check results by segment before you act on the total.
How do you run a MaxDiff study in practice?
Start from the decision. Write down what you will do with the ranking, as described in the first step in the marketing research process, and let that decide the items. Then:
- Draft 10 to 30 items with consistent wording.
- Choose a set size of four or five and a number of tasks that shows each item about three times.
- Generate a balanced design in MaxDiff-capable survey software and test the survey yourself.
- Field it to a sample large enough for the smallest subgroup you need to report on.
- Score the results, by counts for a quick read or by a choice model for utilities.
- Report the ranking with differences between items, not only the order.
The estimation happens in your survey or MaxDiff software. Once you have scores by respondent, Halo Reports can present them by segment in crosstabs and banner tables, with weighting, significance testing and charts. If you run MaxDiff more than once, connect findings across studies so the next ranking starts from what you already know.
Before you field a study, write the 20 items you would test and ask a colleague which two they would merge. Every overlap you find now is a weak result you avoid later.