
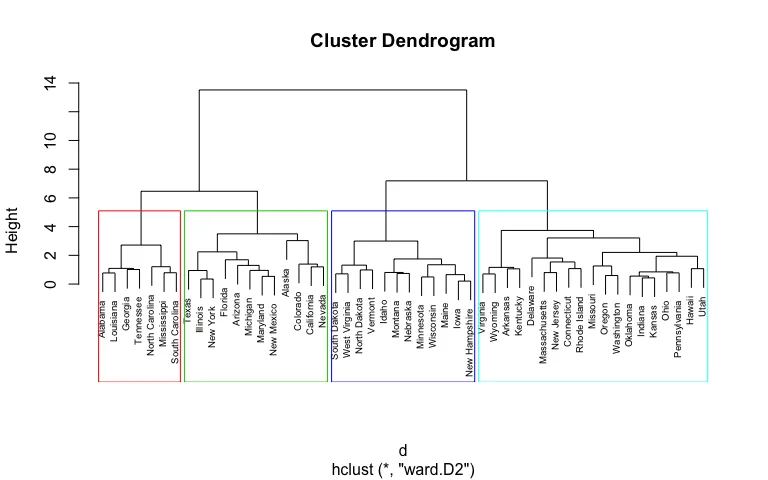
You have survey answers from a few thousand respondents and suspect they fall into a handful of types, but you do not know how many or what separates them. Hierarchical clustering is one way to find out. It is one of the techniques in our guide to factor analysis, PCA and cluster analysis in market research, and this article shows how it works and how to use it on survey data.
Key takeaways
- Hierarchical clustering groups similar respondents by repeatedly merging the two closest groups, producing a tree called a dendrogram that you cut to choose the number of clusters.
- Standardize variables before clustering, because a 0 to 10 question spreads wider than a 1 to 5 question and will otherwise dominate the distances.
- Linkage method shapes the tree: single linkage chains, complete linkage forms compact groups, and Ward linkage, a common starting point for survey work, gives tight, similar-sized clusters.
- Cut the dendrogram just below a long vertical gap, check that clusters are large enough to matter, and keep only groups you can describe in one sentence.
- Unlike k-means, which needs the number of clusters set before the run, hierarchical clustering lets you choose it afterward but gets costly on very large samples.
How does hierarchical clustering work?
Hierarchical clustering builds a family tree of your cases. Each respondent starts alone, the most similar are joined, and the process repeats until everyone sits in one group:
- Choose the variables to cluster on and put them on a common scale.
- Calculate the distance between every pair of respondents.
- Treat each respondent as a cluster of one.
- Merge the two closest clusters.
- Recalculate the distance from the new cluster to the others, using a linkage rule (below).
- Repeat steps 4 and 5 until one cluster remains, recording each merge distance.
- Draw the tree, called a dendrogram, and decide where to cut it.
What is the difference between agglomerative and divisive clustering?
Agglomerative clustering works bottom-up: every case starts as its own cluster and the closest pair is merged at each step. Divisive clustering works top-down: it starts with one cluster holding everyone and splits it, then splits the pieces, until each case stands alone.
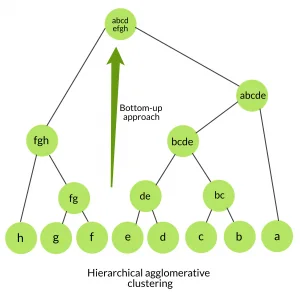
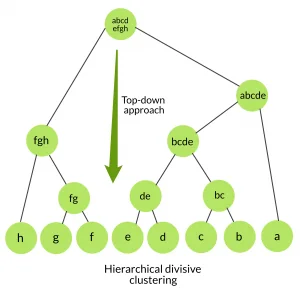
Agglomerative is the one you will meet. A divisive method must consider every way of splitting a cluster in two, and for n cases there are 2^(n-1) - 1 splits: 15 for 5 cases, over 536 million for 30. Divisive methods therefore rely on shortcuts.
Which distance measure should you use?
A distance measure turns two respondents’ answers into one number; bigger means less alike. Three are common.
- Euclidean distance is the straight-line distance: square the difference on each variable, add them up, and take the square root. It suits rating scales and is the one Ward’s method requires.
- Manhattan distance adds up the absolute differences instead, so one large gap on a single question pulls it less.
- Cosine distance compares the pattern of answers rather than their size. It suits text counts and profiles where one person rates everything higher.
Whichever you choose, standardize first. A 0–10 question spreads wider than a 1–5 question and will dominate the distances unless you convert each variable to z-scores.
How do the linkage methods differ?
Once clusters hold more than one case, you need a rule for the distance between two clusters. That rule is the linkage method, and it shapes the tree more than most people expect.
| Method | Distance between two clusters | Typical behavior |
|---|---|---|
| Single | Closest pair of cases, one from each cluster | Chains: joins clusters through a thin bridge of points |
| Complete | Farthest pair of cases | Compact groups; sensitive to outliers |
| Average | Mean of all pairwise distances between the two clusters | A compromise between single and complete |
| Ward | Merges the pair that least increases the total within-cluster variance | Tight, similar-sized, roughly round groups; needs Euclidean distance |
Many analysts start with Ward or average linkage for survey work.
What does a worked example look like?
Take five respondents scored 0–10 on price sensitivity (x) and brand loyalty (y), as (x, y): A (1, 2), B (2, 2), C (5, 6), D (8, 6) and E (8, 8). The numbers are illustrative.
Euclidean distance between A and B is the square root of (2 - 1)² + (2 - 2)², which is 1. D to E is the square root of 0² + 2², which is 2.
C to D is 3. C to E is the square root of 3² + 2², or 3.61. B to C is the square root of 3² + 4², or 5.
Now merge:
| Step | Merge | single | complete | average |
|---|---|---|---|---|
| 1 | A and B (closest pair, distance 1) | 1.00 | 1.00 | 1.00 |
| 2 | D and E (next closest, distance 2) | 2.00 | 2.00 | 2.00 |
| 3 | C joins D and E | 3.00 (C–D) | 3.61 (C–E) | 3.30 |
| 4 | A,B joins C,D,E | 5.00 (B–C) | 9.22 (A–E) | 7.27 |
C could have joined A,B instead, but it is at least 5.00 from them, so D,E wins under every linkage. The step 3 average is (3.00 + 3.61) / 2 = 3.30. The step 4 average is the mean of six distances: (5.66 + 5.00 + 8.06 + 7.21 + 9.22 + 8.49) / 6 = 7.27.
Ward’s method gives the same order. Each merge costs n1 × n2 / (n1 + n2) times the squared distance between cluster centers: 0.50, 2.00, 6.67 and 62.43, which sum to 71.60, the total squared spread of the points around their mean.
How do you read a dendrogram and choose where to cut?
In a dendrogram, each case is a leaf along the bottom and the vertical axis is the distance at which branches join. Read heights, not horizontal positions. Branches can be flipped without changing the tree, so neighboring leaves are not necessarily similar.
To get clusters, draw a horizontal line across the tree. The number of vertical lines it crosses is the number of clusters. In our example, a cut at 2.5 gives three clusters (A,B; C; D,E). A cut anywhere between 3.30 and 7.27 gives two (A,B and C,D,E) under average linkage, and the long gap before the final merge suggests two groups.
Real data is messier, so combine three checks.
- Look for a long vertical gap before a merge, and cut just below it.
- Check cluster sizes. Four people in a sample of 2,000 are probably outliers, not a segment.
- Ask whether you can describe each group in one sentence.
How does hierarchical clustering compare with k-means?
K-means places k centers, assigns each respondent to the nearest, moves the centers, and repeats.
| Question | Hierarchical | K-means |
|---|---|---|
| Number of clusters | Chosen after, by cutting the tree | Set before the run |
| Output | A nested tree | One flat set of groups |
| Repeatability | Same result for the same data and settings | Depends on starting centers; run several starts |
| Sample size | Needs every pairwise distance, so cost grows with the square of the sample | Handles large samples easily |
A common workflow is to cluster a sample hierarchically to see how many groups the data supports, then run k-means on the full sample with that k.
How do you use hierarchical clustering for survey segmentation?
- Pick the inputs. Use attitudes, needs or behaviors; keep demographics for describing segments. If you have dozens of correlated rating items, reduce them first with principal component analysis or factor scores, as covered in practical uses of factor analysis.
- Clean and scale. Handle missing answers, remove straight-liners who gave the same answer to every item, and standardize.
- Run Ward linkage on Euclidean distance and study the dendrogram. Shortlist candidate solutions, for example four, five and six segments.
- Profile each solution. Cross-tabulate segment membership against the clustering variables, demographics, purchase intent and usage. Once each respondent carries a segment label, Halo Reports can profile it with crosstabs and banner tables that include weighting and significance testing, plus charts and interactive report pages. Wide, complex studies fit one governed platform for insights and research teams.
- Test stability. Re-run on a random half of the sample and with a second linkage method. Segments that keep reappearing are more trustworthy.
- Choose the solution you can act on. Each segment should be large enough to matter and different in a way that changes what you would do.
What are the common mistakes with hierarchical clustering?
- Skipping standardization. The widest-ranging variable quietly decides the result.
- Using single linkage on noisy data. You get one giant cluster plus a trail of single respondents.
- Treating the output as proof. Clustering returns groups even for random data. Check stability and interpretability.
- Running it on a very large sample. Cluster a subsample first.
- Using it where it does not fit. It is the wrong tool for plain categorical data without a suitable distance, or when you already know the groups and want to predict membership.
To try it, take a survey you already have, choose six to ten attitude questions, standardize them and run Ward linkage on a random sample of a few hundred respondents. Cut the tree at two heights and see which solution you can describe in a sentence per segment. For brand segments, track brand health, consideration and competitors continuously.