
You have a survey with a satisfaction question, an education question and a ranking exercise, and the output table is full of numbers. Before you average anything, you need to know what those numbers mean. That is the question of measurement level, which our guide to survey data types covers in full. This article takes the level that causes the most trouble: ordinal data.
Key takeaways
- Ordinal data has categories in a natural order but with unknown gaps, so you can say one answer ranks above another, not by how much.
- Summarize ordinal data with the mode, median, percentiles and top-box shares, and compare groups with rank-based tests such as Mann-Whitney U or Kruskal-Wallis.
- Two groups can have similar means and the same median yet differ sharply, so show the full distribution rather than one summary number.
- Averaging a Likert scale is debated, so report the distribution and top-box share first and show a mean only as a secondary figure.
- Chart ordinal data with categories in their natural order, never sorted by size, and avoid pie charts because they lose the order that defines the data.
What does “ordinal” mean in statistics?
Ordinal data has categories that can be put in a meaningful order, but the distance between neighboring categories is unknown and may not be equal. “Ordinal” comes from “order”, and that is the whole idea: you can say one answer is more or less than another, and nothing more precise.
Take a five-point scale from very dissatisfied to very satisfied. The step from dissatisfied to neutral is not guaranteed to match the step from satisfied to very satisfied, and two people choosing “satisfied” may feel quite differently. The numbers 1 to 5 are labels that preserve order, not measurements.
How do nominal, ordinal, interval and ratio data differ?
The psychologist S. S. Stevens proposed these four levels in 1946, and they are still the standard way to decide which statistics fit a variable. Each level adds a property to the one before it.
| Level | What it tells you | Survey example | Typical summary | Typical test |
|---|---|---|---|---|
| Nominal | Categories with no order | Brand last purchased | Mode, percentages | Chi-square |
| Ordinal | Order, but unequal or unknown gaps | Satisfaction scale, education level | Median, mode, percentiles | Mann-Whitney, Kruskal-Wallis, Spearman |
| Interval | Equal gaps, no true zero | Temperature in Celsius | Mean, standard deviation | t-test, Pearson correlation |
| Ratio | Equal gaps and a true zero | Spend, number of purchases | Mean, ratios | Same as interval |
Ordinal data lets you say “more than”, which nominal data does not, but not “twice as much”, which ratio data does. To see how nominal categories are recoded for models, read our article on dummy variables.
What are examples of ordinal data in surveys?
Rating and Likert-type scales
Agreement, satisfaction, likelihood and importance scales are ordinal. Strictly, a Likert scale combines several such items, and a single item is a Likert-type item.
Rankings
If you ask respondents to put five features in order of preference, the result is a rank from 1 to 5. A rating lets someone give two features the same score, while a ranking forces a choice. Rankings show relative preference, not intensity: a first choice might beat the second by a hair or by a mile.
Education level and other ordered bands
“Some high school, high school graduate, bachelor’s degree, master’s degree, doctorate” is ordinal. Coding these 1 to 5 does not mean a master’s degree is four times a high school education. Income and age ranges behave the same way: the bands are ordered, differ in width, and discard the exact value.
Which statistics are appropriate for ordinal data?
Use statistics that depend only on order: the mode, median and percentiles for summaries, and rank-based (non-parametric) tests for comparisons.
Summaries: mode, median and percentiles
The mode is the most common answer. The median is the middle answer once everyone is sorted from lowest to highest, which is the 50th percentile. Top-box and bottom-box percentages, the share choosing the top two or bottom two points, are simple proportions, so they are safe at any measurement level.
Comparisons: rank-based tests
The Mann-Whitney U test compares two independent groups, such as customers and non-customers. The Wilcoxon signed-rank test compares two related measurements, such as the same respondents before and after a campaign. The Kruskal-Wallis test compares three or more independent groups.
Spearman’s rank correlation and Kendall’s tau measure how consistently two ordered variables rise together, and ordinal logistic regression models an ordinal outcome. These tests assume less about the shape of the data than a t-test, but they still assume things, such as independent observations.
Worked example: similar means, different groups
The numbers below are illustrative. Twenty respondents in each of two groups answer a five-point satisfaction question, coded 1 (very dissatisfied) to 5 (very satisfied).
| Answer | Code | Group A count | Group B count |
|---|---|---|---|
| Very dissatisfied | 1 | 2 | 9 |
| Dissatisfied | 2 | 3 | 0 |
| Neutral | 3 | 6 | 2 |
| Satisfied | 4 | 5 | 0 |
| Very satisfied | 5 | 4 | 9 |
For Group A, the median sits between the 10th and 11th respondents in sorted order. The running count is 2 after code 1, 5 after code 2 and 11 after code 3, so both are neutral and the median is neutral, which is also the mode (6 of 20). The 15th respondent falls in satisfied (running count 16 after code 4), so the 75th percentile is satisfied.
| Measure | Group A | Group B |
|---|---|---|
| Mean of the codes | (2 + 6 + 18 + 20 + 20) / 20 = 3.3 | (9 + 6 + 45) / 20 = 3.0 |
| Median | Neutral | Neutral (running count 9, then 11) |
| Top-two box | 9 / 20 = 45% | 9 / 20 = 45% |
| Bottom-two box | 5 / 20 = 25% | 9 / 20 = 45% |
The means differ by 0.3 and the medians match, yet Group B is polarized: 18 of 20 chose an extreme answer and only 2 chose neutral. One summary number hides that; the distribution shows it.
Can you average a Likert scale?
Both sides of this long-running argument have a case.
The strict position says the gaps between points are unknown, so adding codes and dividing is not defined. Means can also mislead, as the example shows: the same mean can come from very different distributions.
The pragmatic position says that with five or more points, or several items combined into a score, the result behaves enough like an interval measure that means and t-tests are acceptable. Means are also easy to trend and easy to read.
A sensible middle path is to report the distribution and top-box share as the primary result, use the median or a rank-based test for formal comparisons, and show a mean only as a secondary figure when your audience expects one. Whichever you choose, say so in the report.
How do you chart ordinal data?
Keep the order visible. Show categories in their natural sequence, never sorted by size, and use a single-hue color ramp so the order reads without a legend.
- One question, one group: a column chart in scale order, or a single stacked bar.
- Comparing groups: a 100% stacked bar per group with the same color ramp, so shifts in the distribution show.
- Change over waves: a line chart of the top-box share or median for each wave.
- Rankings: a bar chart of the average rank or the share ranking each item first.
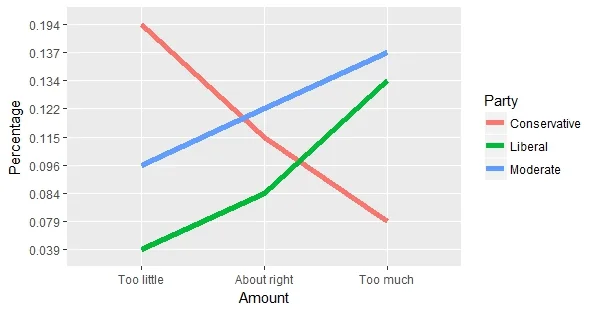
A line can also follow each group across an ordered answer, as in the chart at the top of this article. Avoid pie charts for scales, because they lose the order that defines the data.
What mistakes do people make with ordinal data?
- Treating the codes as measurements. A 4 is not twice a 2.
- Reporting only the mean. The worked example shows how it hides a polarized group.
- Sorting scale categories by size in a chart. This destroys the order.
- Running a chi-square test and ignoring order. It treats the categories as unordered and wastes the ranking.
- Collapsing the scale too early. Merging categories into agree and disagree throws away detail you cannot get back.
How do you do this in practice?
Halo Reports builds crosstabs and banner tables with weighting and significance testing, plus charts and interactive report pages, so you can show a scale’s full distribution for each group. See the Halo Reports page.
Next time you open a scale question, write down its measurement level first. Start with the distribution and the median, add a rank-based test to compare groups, and treat any mean as a supporting number. Teams that run wide, complex studies and global brand trackers can do this on one governed platform for insights and research.