What is statistical significance?

Statistical significance is the observed difference between groups or variables that is unlikely to have occurred by chance.

Visualize Surveys + Shop Market Research 

Access, analyze, and visualize the leading market research at mTab.

Statistical significance is a statistics term to determine whether an observed difference or relationship between two or more groups or variables is unlikely to have occurred by chance. It is the probability of obtaining a result as extreme or more extreme than the observed result, assuming that there is no real difference or relationship between the groups or variables being compared.

Statistical significance is an important concept in research because it helps researchers to determine whether their results are meaningful or not. If a result is not statistically significant, it means that there is a high probability that the result could have occurred by chance alone. In this case, the result may not be meaningful and further research may be needed.

There are a number of different ways to calculate statistical significance. The most common way is to use the p-value. The p-value is a number that represents the probability of obtaining the observed result if the null hypothesis were true. The null hypothesis is the hypothesis that there is no difference between the groups being studied.

Examples of statistical significance

Here are some examples of statistical significance:

  1. A clinical trial conducted to test the effectiveness of a new drug for treating a disease. The study randomly assigns participants to receive either the new drug or a placebo (a fake treatment). If the results show that the group receiving the new drug has significantly better outcomes than the group receiving the placebo, this difference is statistically significant.
  2. An analysis of the relationship between smoking and lung cancer. A study may find that smokers have a higher incidence of lung cancer than non-smokers. If the difference is statistically significant, it provides evidence that smoking is associated with an increased risk of lung cancer.
  3. A survey conducted to determine if there is a difference in income levels between men and women. If the results of the survey show that men have a significantly higher income than women, this difference is statistically significant and suggests that there may be gender-based income inequality.
  4. A study comparing the effectiveness of two different teaching methods in improving students' test scores. If one method leads to significantly better test scores than the other, this difference is statistically significant and suggests that one method may be more effective than the other.

In each of these examples, statistical significance provides evidence that there is a real difference or relationship between the variables being compared and that this difference or relationship is not due to chance alone.

Tips for Understanding Statistical Significance

Here are a few tips for understanding statistical significance:

  • The p-value is not a perfect measure of statistical significance. There are a number of factors that can affect the p-value, such as the sample size and the distribution of the data.
  • The chosen significance level is arbitrary. There is no right or wrong choice for the chosen significance level. The researcher needs to choose a significance level that is appropriate for their study.
  • Statistical significance does not mean that the results are important. A result may be statistically significant, but it may not be important. The researcher needs to consider the size of the effect and the practical implications of the results.

Statistical significance and p-values

Statistical significance is a measure of the likelihood that the observed difference or relationship is not due to random chance but is instead due to some underlying cause or effect. This measure is often expressed as a p-value, which is the probability of obtaining a result as extreme or more extreme than the observed result, assuming that there is no real difference or relationship between the groups or variables being compared.

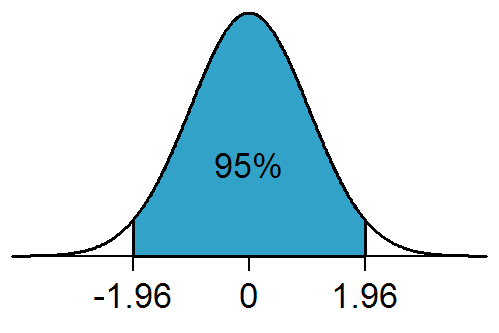
If the p-value is less than a predetermined level of significance (usually 0.05 or 0.01), then the result is considered statistically significant, which means that there is strong evidence that the observed difference or relationship is not due to chance alone. If the p-value is greater than the level of significance, then the result is considered not statistically significant, which means that there is insufficient evidence to conclude that the observed difference or relationship is not due to chance alone.

How is statistical significance used?

Statistical significance is widely used in many fields, including science, social science, medicine, engineering, and economics, to make decisions and draw conclusions based on data analysis. Here are some of the ways statistical significance is used:

  1. Hypothesis testing: Statistical significance is used to test hypotheses and determine whether a particular relationship or difference between variables is statistically significant. Researchers use statistical tests, such as t-tests, ANOVA, and chi-square tests, to calculate p-values and determine statistical significance.
  2. Decision-making: Statistical significance is used to make decisions about whether to accept or reject a particular hypothesis or to choose between alternative courses of action. For example, in a clinical trial, if the new drug is found to be statistically significantly more effective than the placebo, the researchers may decide to recommend the new drug for use.
  3. Confidence intervals: Statistical significance is used to calculate confidence intervals, which provide a range of values within which the true population value is likely to lie. Researchers use confidence intervals to estimate the precision of their results and to provide a range of plausible values for the effect size.
  4. Meta-analysis: Statistical significance is used in meta-analysis, which is a method for combining the results of multiple studies to obtain a more robust estimate of the true effect size. Researchers use statistical tests, such as the Q-test and I-squared statistic, to determine the degree of heterogeneity and statistical significance of the meta-analytic results.

Overall, statistical significance is a powerful tool that enables researchers to draw valid conclusions from their data and make evidence-based decisions. However, it is important to keep in mind that statistical significance alone does not necessarily imply practical significance or real-world importance.

Try running your statistical significance tests on survey data with mTab for free.

John Sevec

SVP, Client Strategy

John provides strategic advisory and insight guidance to premier clients across mTab’s portfolio. His expertise spans customer strategy, market insight and business intelligence.