Ask your data
Get answers from your data in minutes.
Ask questions in plain language and get answers from your own research, with the source shown.

In short
Conversational analytics lets people ask questions of their data in plain language. With mTab, stakeholders ask the way they would ask a researcher and get answers from your own research and data, with the studies, cuts and figures shown and the same access controls as the underlying data.
The challenge
Simple stakeholder questions can take days to answer because the answer spans several studies, and someone has to find it, cut it and chart it. In the meantime, decisions get made without it.
- 1
Ask
Type the question the way a stakeholder would ask it, for example: has consideration moved among first-time SUV buyers this quarter?
- 2
Answer
mTab answers from your connected research and data, showing the studies, cuts and figures behind it.
- 3
Explore
Follow up, change the segment, compare periods, or turn the answer into a chart or brief.
- 4
Govern
Answers follow the same access controls as the underlying data, so people see only what they are permitted to.
What teams ask
-
How a metric moved
Has consideration changed among first-time buyers this quarter, and in which markets?
-
How segments compare
How does satisfaction differ between new and long-standing customers?
-
Why something happened
What are customers saying about the new packaging in the last two waves?
-
What past research says
What did earlier studies find about price sensitivity in this segment?
Platform capabilities
- Ask Pulse
- Answers with citations
- Follow-up analysis
- Governed access
Teams
Halo Reports and your research
Ask questions of your survey data.
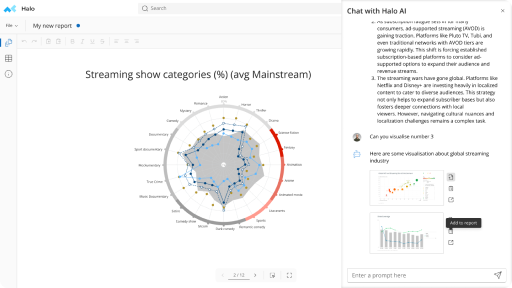
Ask in plain language and Halo answers from your survey data and reports, returning verified crosstabs, charts and written answers you can add to a report.
- Answers produced by Halo's analytical engine, not guessed
- Charts and tables added to reports in one step
- Access follows the permissions on the underlying study
Related reading
All articles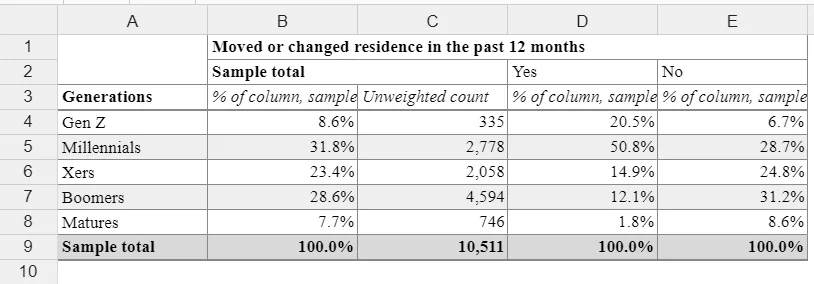
Survey analysis
What is a crosstab? Crosstab examples, terms and how to read one
What a crosstab (cross tab) is, with a worked example, three short business examples, the terms banner, stub, base and net, and when a crosstab beats a pie chart.

Survey analysis
How to Analyze Survey Data: A Step-by-Step Guide to Survey Analysis
Survey analysis step by step: the three core ways to analyze survey data, then clean, weight, run toplines, crosstab, test significance, code open-ends, and chart and report.
FAQ
Ask your data: common questions.
What kinds of questions can we ask?
How a metric moved, how segments compare, why something happened and what past research found. For example: has consideration changed among first-time buyers this quarter, and in which markets?
Where do the answers come from?
From your connected research and data. Each answer shows the studies, cuts and figures behind it, so it can be checked.
Can everyone see all of the data?
No. Answers follow the same access controls as the underlying data, so people see only what they are permitted to.
Want to see ask your data with your data?
Bring one tracker or study. We'll show you what Pulse would surface for your team before we meet.