
Most survey answers are labels, not numbers. Region, brand used, and job function have no natural arithmetic, yet you often want to test whether they move a number such as satisfaction or purchase intent. Dummy variables are how you hand a label to a model that only accepts numbers. They are one of the standard tools in our guide to survey data types.
Key takeaways
- What are dummy variables? They are 0/1 columns that stand in for a category, letting regression and other numeric models use labels such as region or brand.
- Code a variable with k categories as k − 1 dummies; the category left out is the reference, and respondents in it score 0 on every dummy.
- Each dummy coefficient is the difference from the reference category, not the group’s own average, and the intercept is the reference group’s average.
- The dummy variable trap means including all k dummies alongside an intercept, which creates perfect multicollinearity and no unique set of coefficients.
- A select-all-that-apply question is already a set of dummies with no column dropped, and the mean of each 0/1 column is the share who chose it.
What is a dummy variable?
A dummy variable has two values. It is 1 if the respondent has the characteristic and 0 if not. “Lives in the East region” is a dummy: every respondent gets a 1 or a 0.
Statisticians also call it an indicator variable, a binary variable, or a 0/1 flag. The “dummy” part just means it stands in for a category. The numbers carry no size or order. A 1 is not “more” than a 0, it is a yes.
How do you code a categorical variable into dummies?
Take a variable with k categories and create k − 1 dummy variables. The one category you leave out is the reference category (also called the baseline). It is the respondent who scores 0 on every dummy.
Worked example: a three-level region variable
Suppose region has three levels: East, Central, and West. We choose West as the reference and create two dummies, East and Central.
| Respondent | Region | East | Central |
|---|---|---|---|
| 1 | East | 1 | 0 |
| 2 | Central | 0 | 1 |
| 3 | West | 0 | 0 |
| 4 | East | 1 | 0 |
| 5 | West | 0 | 0 |
West has no column of its own. A respondent who has 0 on East and 0 on Central is in West, so the information is still there.
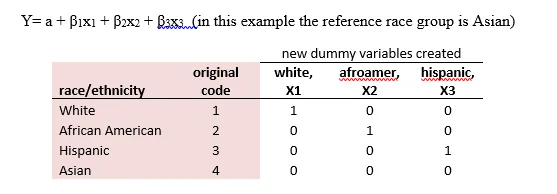
The same idea works for any number of levels. The table below codes a four-category race and ethnicity variable into three dummies (X1, X2, X3), with Asian as the reference group.
How do you choose the reference category?
The choice does not change the model’s fit or its predictions. It changes which comparisons the coefficients show. Pick the category that makes the comparison meaningful: a natural baseline (the control group, your own brand, “none”), or the largest group, which gives the most stable comparison. Avoid a tiny category as the reference, because every coefficient is then measured against a noisy baseline.
How do you interpret the coefficients on dummy variables?
Now regress satisfaction (a 0 to 10 scale) on the two dummies:
satisfaction = a + b1 x East + b2 x Central
Suppose the average satisfaction scores are as follows. These numbers are illustrative.
| Region | Average satisfaction | Model term | Value |
|---|---|---|---|
| West (reference) | 6.0 | Intercept a | 6.0 |
| East | 7.4 | b1 = 7.4 − 6.0 | 1.4 |
| Central | 6.8 | b2 = 6.8 − 6.0 | 0.8 |
The reading rules are simple:
- The intercept is the average for the reference category. West respondents average 6.0.
- Each dummy coefficient is the difference from the reference, holding other variables constant. East respondents score 1.4 points higher than West; Central respondents score 0.8 points higher.
- To get another group’s average, add its coefficient to the intercept. East is 6.0 + 1.4 = 7.4.
Change the reference and the same data gives different coefficients. With East as the reference, the intercept is 7.4, West is −1.4, and Central is 6.8 − 7.4 = −0.6. Nothing about the groups changed, only the point of comparison. This also means a p-value on a dummy answers “is this group different from the reference?”, not “is this group different from the rest?”.
What is the dummy variable trap?
The trap is including all k dummies in a model that also has an intercept. In the region example, East + Central + West equals 1 for every respondent. That sum is identical to the constant column the intercept uses, so the model cannot tell them apart. This is perfect multicollinearity, and there is no single best set of coefficients.
What happens in practice depends on your software. Some packages stop with an error, and others silently drop one column. Either way, you should know which category was dropped, because it has just become your reference.
You can avoid the trap in two ways. Drop one dummy and keep the intercept (the standard approach above). Or keep all k dummies and remove the intercept, in which case each coefficient is that group’s own average. The second form is harder to extend once you add other predictors, so most analysts use the first.
How are dummy variables used in survey research?
Multi-response questions
A “select all that apply” question is already a set of dummies. Ask “Which of these channels do you use to research purchases?” and code each option as its own column: 1 if selected, 0 if not.
| Respondent | Search | Social | Reviews | Retailer site |
|---|---|---|---|---|
| 1 | 1 | 0 | 1 | 0 |
| 2 | 1 | 1 | 0 | 0 |
| 3 | 0 | 0 | 1 | 1 |
| 4 | 1 | 0 | 0 | 1 |
Here you do not drop a column. Respondents can pick several options, so the columns are not forced to sum to 1 and there is no trap. Each column is a separate yes/no question.
A handy property: the mean of a 0/1 column is the share of respondents who chose it. In the table, Search has a mean of 3 / 4 = 0.75, so 75 percent of this tiny sample selected it. That is also why a column of dummies is easy to summarize as a percentage.
Other common uses
- Segments as predictors. Customer type, region, or plan tier enter a regression as k − 1 dummies.
- Yes/no outcomes. A purchase or churn flag coded 0/1 is the outcome in a logistic regression.
- Comparisons across waves. A tracker wave becomes a set of dummies when you want to estimate change against a baseline wave.
- Ordinal answers when the order is not usable. A scale can be split into dummies, but you lose the ordering. See what ordinal data is before deciding.
What mistakes do people make with dummy variables?
- Including every category. The trap above. Always count your dummies against the intercept.
- Reading a coefficient as an average. A dummy coefficient is a difference from the reference, not the group’s own score.
- Forgetting which category is the reference. Write it next to every result. A table of coefficients with no stated baseline cannot be interpreted.
- Using a tiny reference group. Every comparison inherits its noise.
- Entering category codes as numbers. Putting region coded 1, 2, 3 into a regression as one variable assumes Central is exactly halfway between East and West. Use dummies instead.
- Dummies for too many levels. A variable with 40 categories and 300 respondents creates 39 unstable estimates. Combine small categories first.
How do you do this in practice?
Before building a model, check whether the difference you care about is visible at all. Halo Reports produces crosstabs and banner tables with weighting and significance testing, which is the usual first look at how a score differs by region, segment, or channel. If the pattern holds and you need to control for other variables, move to a regression with dummies.
Next time you open a dataset, list your categorical variables and decide the reference category for each before you run anything. Write the choice down, and your coefficients will be easy to read months later. For wide, complex studies and global trackers, a governed platform for insights teams keeps those choices in one place.